
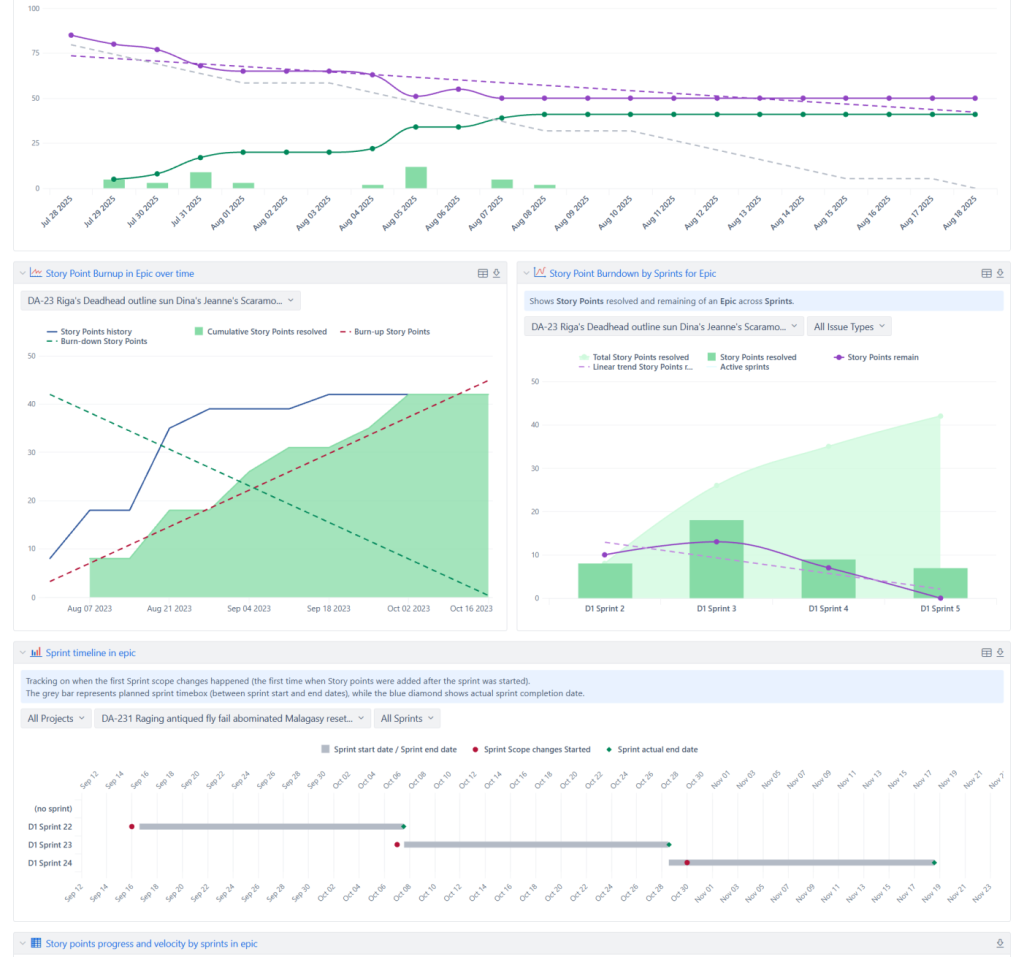
Project and Program Management in Jira, Confluence and EazyBI
Run hybrid, Agile, and classic projects in Jira. Combine Jira...
Read More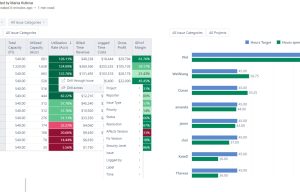
Vacation Balance Tracking
Template Vacation Balance Tracking Template Track vacation balances, approvals, and...
Read More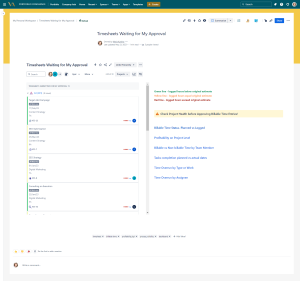
Timesheet Template with Atlassian Jira
Track work hours, approvals, and project time allocation with the...
Read More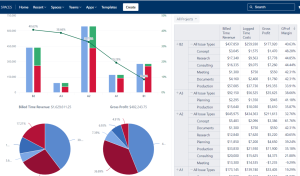
Resource and Capacity Management Template
Template Resource and Capacity Management Template Plan, forecast, and track...
Read More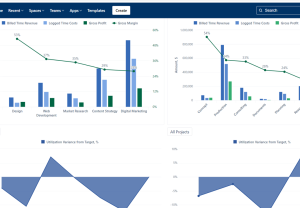
Agile Accounting and Dev Time Capitalization Template
Template Agile Accounting and Dev Time Capitalization Template Track development...
Read More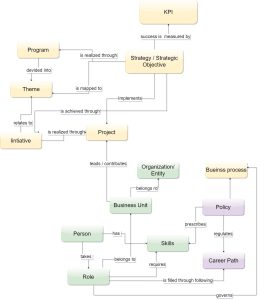
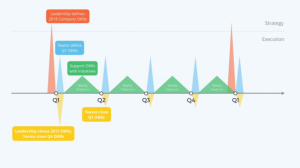
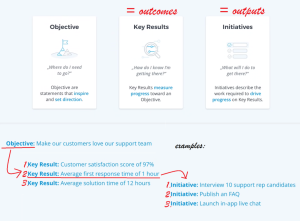
Objective and Key Results (OKR) Template
Template Objectives and Key Results (OKR) Set ambitious goals, align...
Read More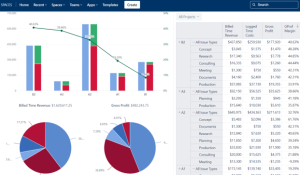
Portfolio Performance Report Template
Template Portfolio Performance Report Template for Atlassian Track portfolio health,...
Read More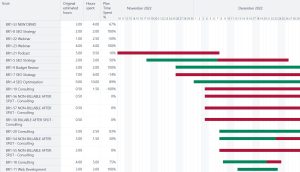
Jira Project Status Report Template
Create automated, real-time project status reports with the Jira and...
Read More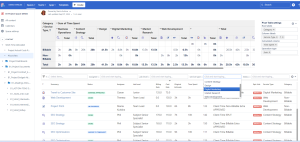
Financial Report Template
Monitor cost, margins, utilization, and profitability with Financial Report Template...
Read More
Atlassian Change Management Consulting Service
Consulting Services Atlassian Change Management Consulting Service An Atlassian change...
Read More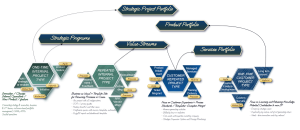
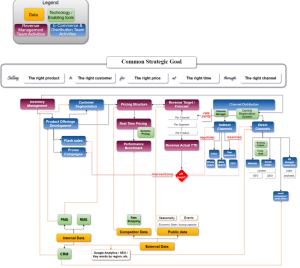
Strategic Portfolio and Program Management Consulting
Consulting Services in progress We design a clear target architecture...
Read More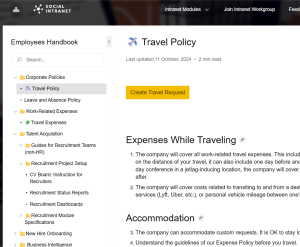
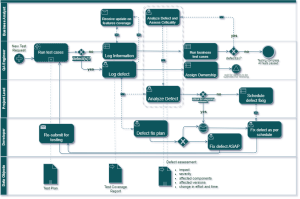
Standard Operating Procedure (SOP) Development Services
Consulting Services SOP Development Services Standard Operating Procedures integrated into...
Read More
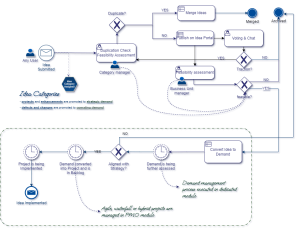

Process Modelling and Diagramming
Atlassian Solution Enterprise Architecture & CMDB with Jira Service Management...
Read More