

Key Performance Indications (KPI) Template
Template Key Performance Indicators (KPI) Template Define, measure, and track...
Read More
Objective and Key Results (OKR) Template
Template Objectives and Key Results (OKR) Set ambitious goals, align...
Read More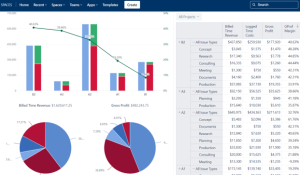
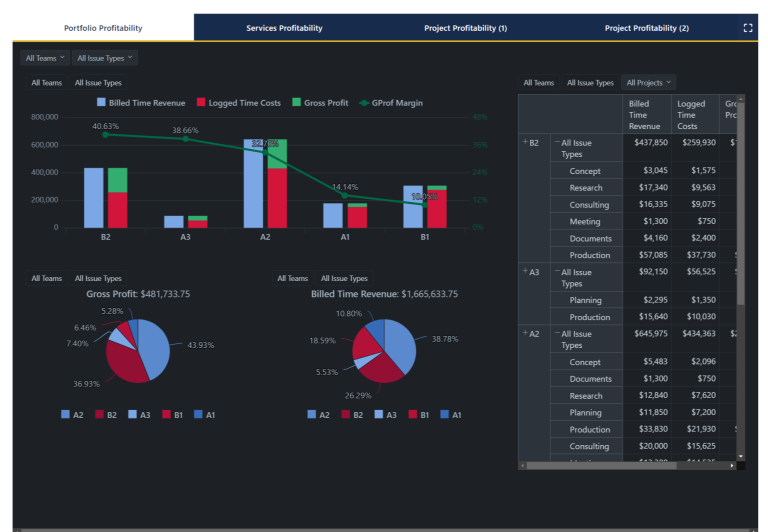
Portfolio Performance Report Template
Template Portfolio Performance Report Template for Atlassian Track portfolio health,...
Read More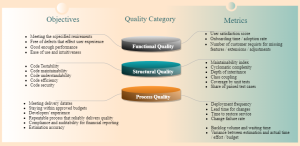
Developer Metrics and Report Template
Template Developer Metrics and Report Template for Atlassian Track engineering...
Read More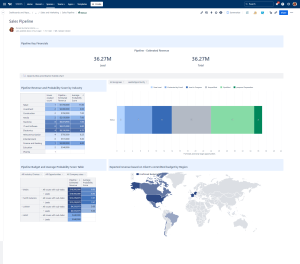
Sales and Marketing Report Template for Atlassian Jira and Confluence
Track campaigns, leads, opportunities, and performance with the Sales and...
Read More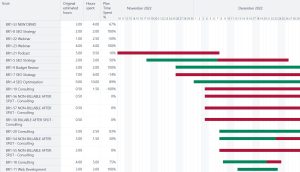
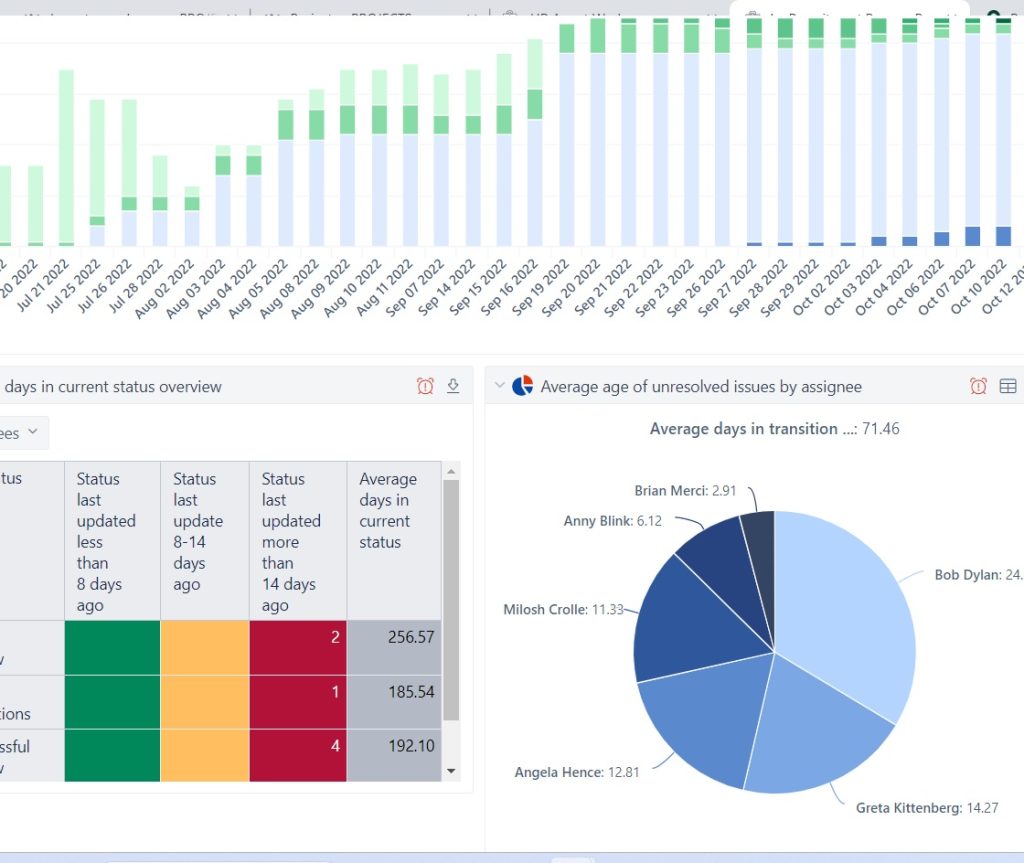
Jira Project Status Report Template
Create automated, real-time project status reports with the Jira and...
Read More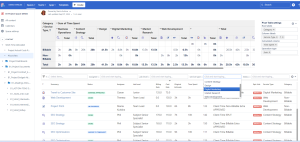
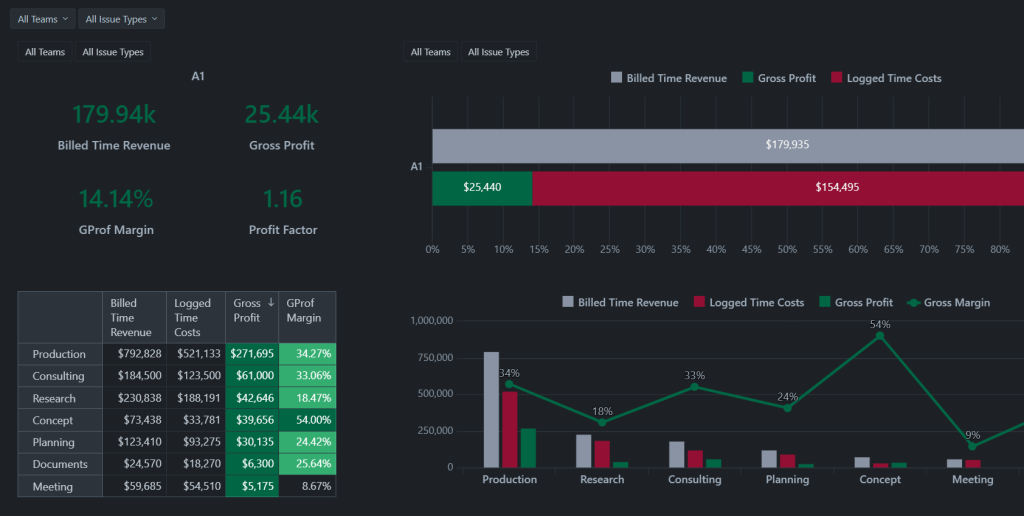
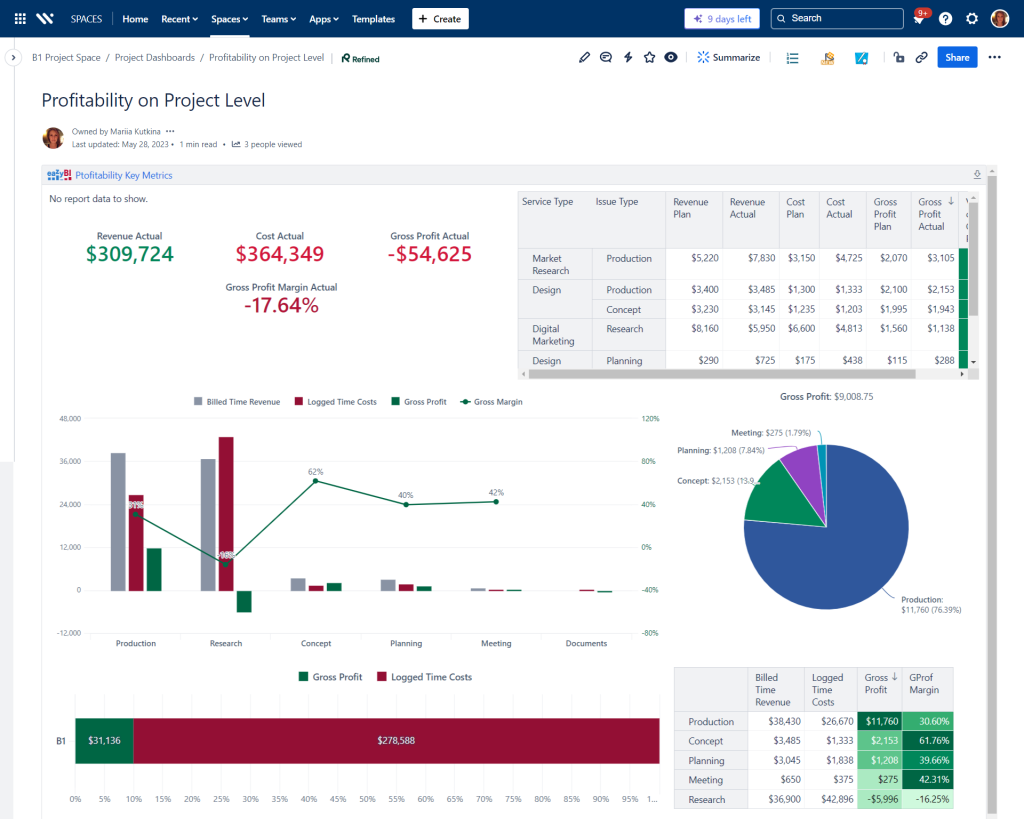
Financial Report Template
Monitor cost, margins, utilization, and profitability with Financial Report Template...
Read More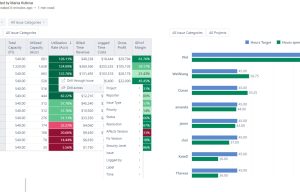
Human Capital Report Template with Jira and EazyBI
Track skills, performance, utilization, learning, and workforce health with the...
Read More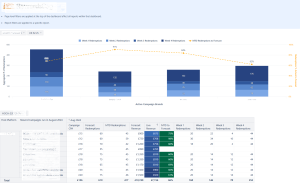
Data Analytics and Business Intelligence Services
Consulting Services Data Analytics and Business Intelligence Services Data analytics...
Read More