-
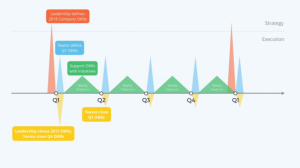
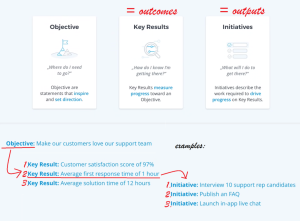
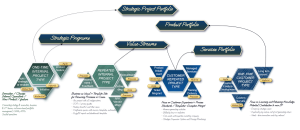
1. Discover OKRs
-
2. Design KPIs
-
3. Build Dashboards
-
4. Validate Results
-
5. Operationalize Governance
Align reporting goals to OKRs and define the decisions dashboards must support. Confirm stakeholder needs and the current gaps in Jira and JSM reporting.

Define KPI definitions, filters, and thresholds that measure OKR progress consistently. Set dashboard standards so reporting stays comparable across teams.
Deliver dashboard packs in Jira and EazyBI with drill-down for actionability. Keep designs reusable so new teams can be onboarded faster.
Review dashboards with stakeholders and confirm metrics reflect operational reality. Refine definitions and views before scaling across departments.
Introduce KPI ownership, refresh cadence, and change control for reporting updates. Maintain trust with data quality checks and continuous improvement loops.

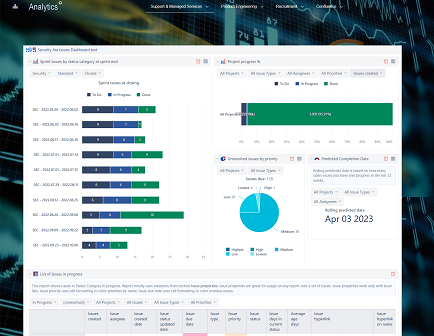
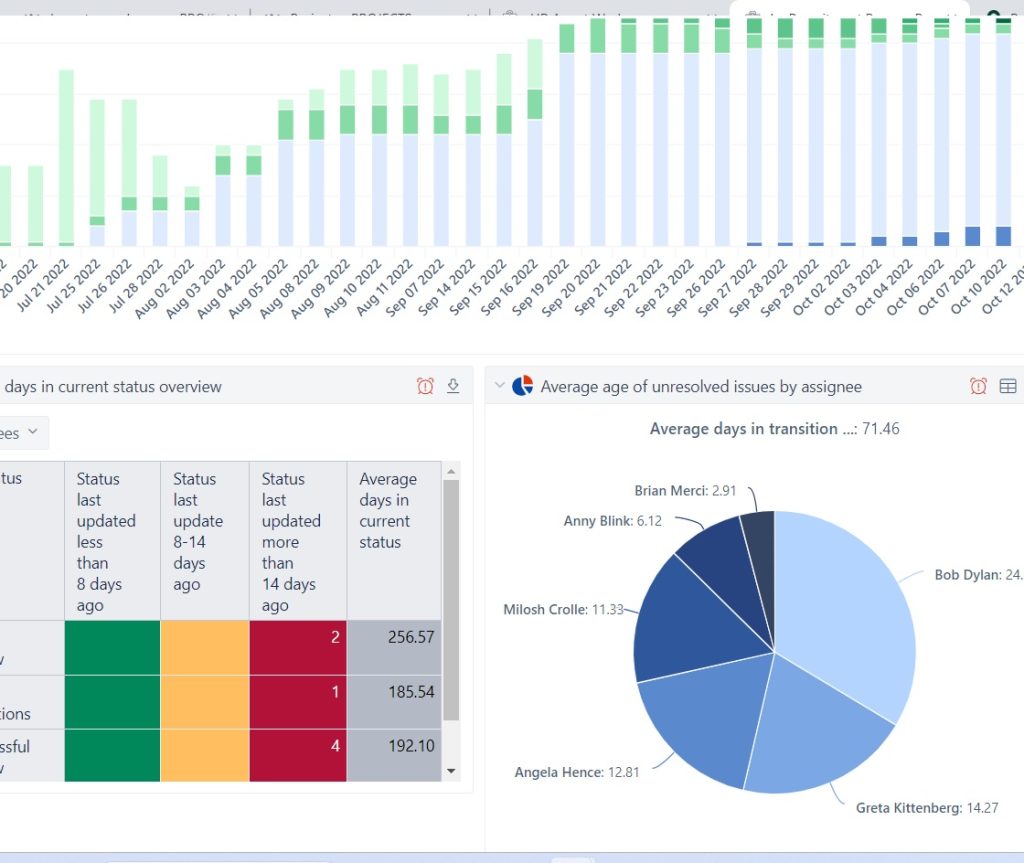
Data Analytics eazyBI (Advanced Reporting for Atlassian Jira)
Data analytics eazyBI solution for Jira and Confluence: custom reports,...
Read More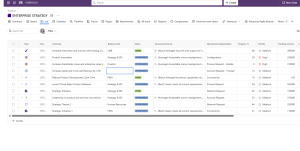
Key Performance Indications (KPI) Template
Template Key Performance Indicators (KPI) Template Define, measure, and track...
Read More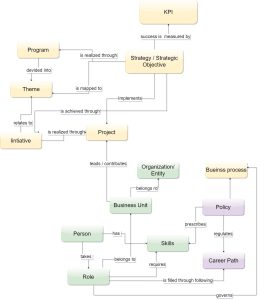
Objective and Key Results (OKR) Template
Template Objectives and Key Results (OKR) Set ambitious goals, align...
Read More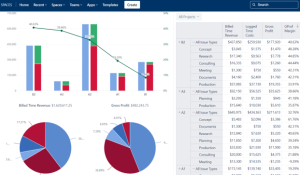
Portfolio Performance Report Template
Template Portfolio Performance Report Template for Atlassian Track portfolio health,...
Read More
Developer Metrics and Report Template
Template Developer Metrics and Report Template for Atlassian Track engineering...
Read More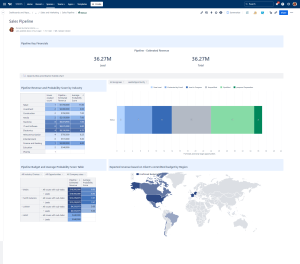
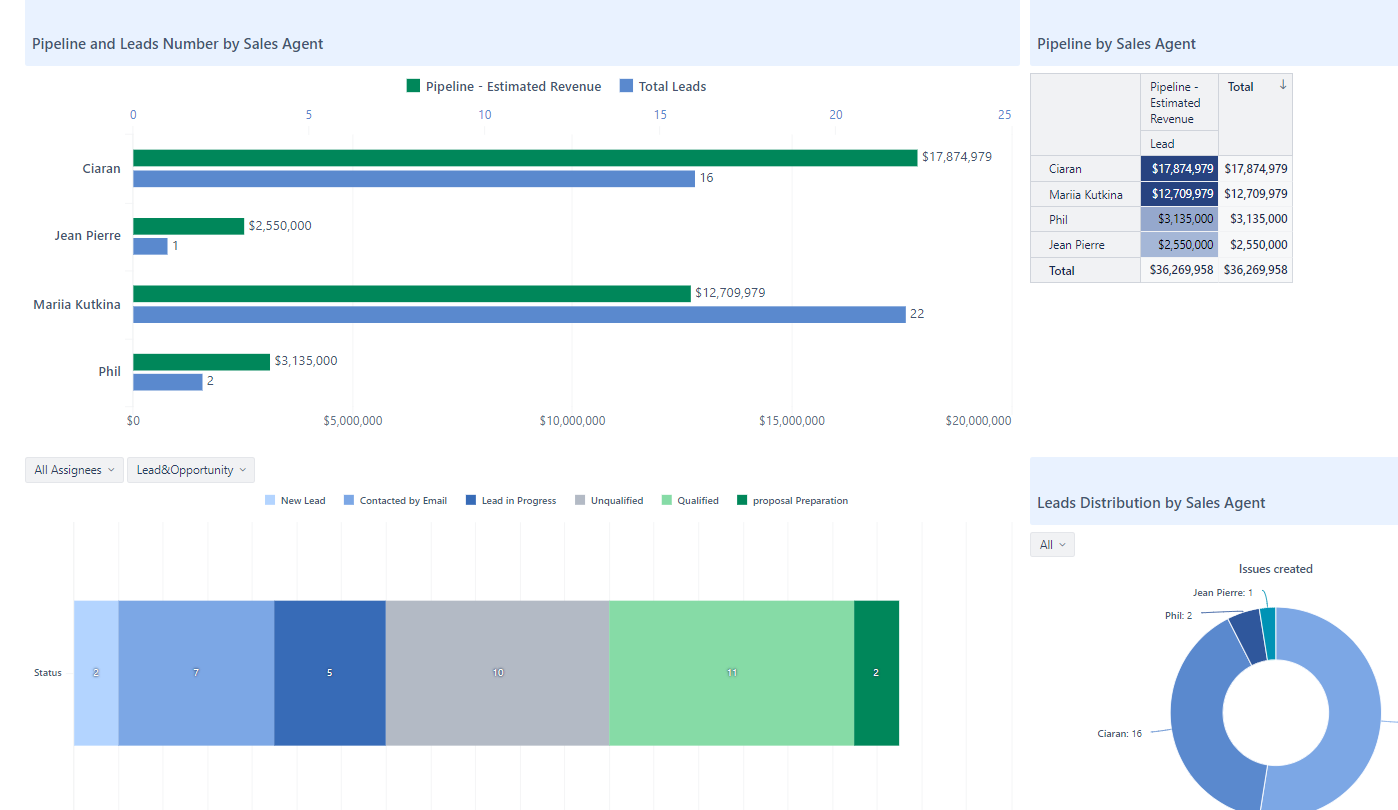
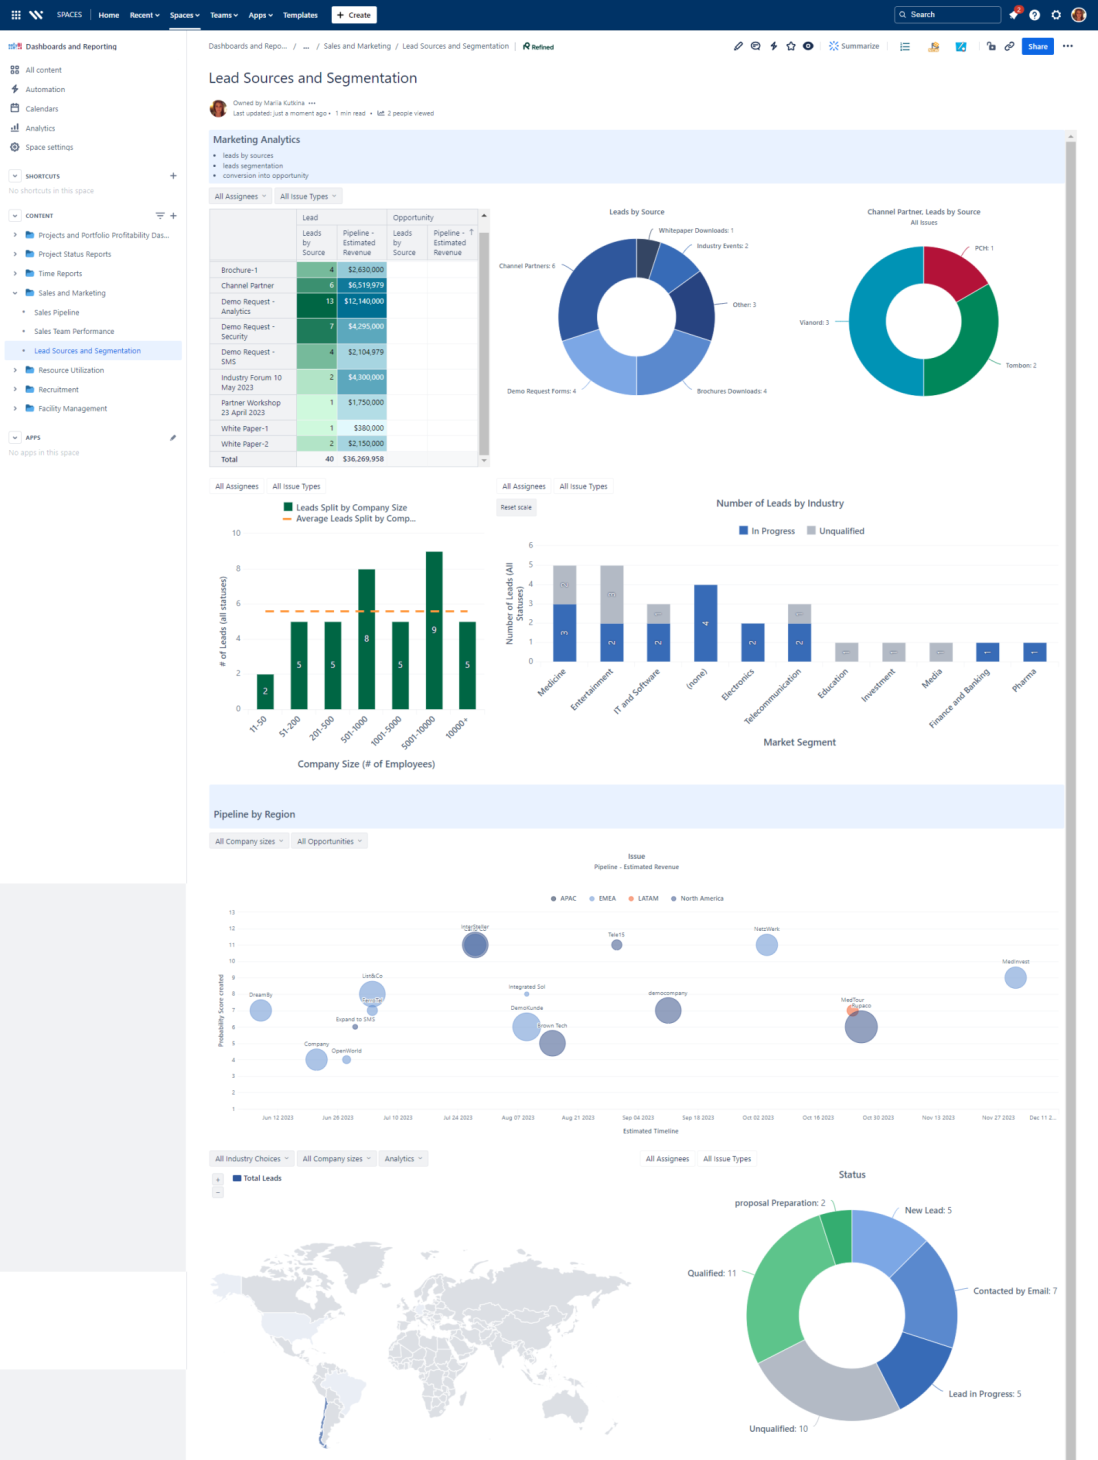
Sales and Marketing Report Template for Atlassian Jira and Confluence
Track campaigns, leads, opportunities, and performance with the Sales and...
Read More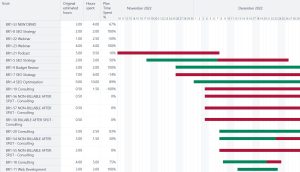
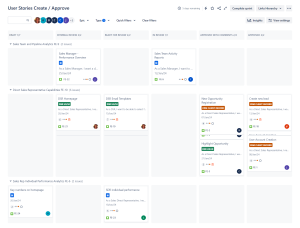
Jira Project Status Report Template
Create automated, real-time project status reports with the Jira and...
Read More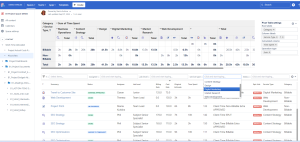
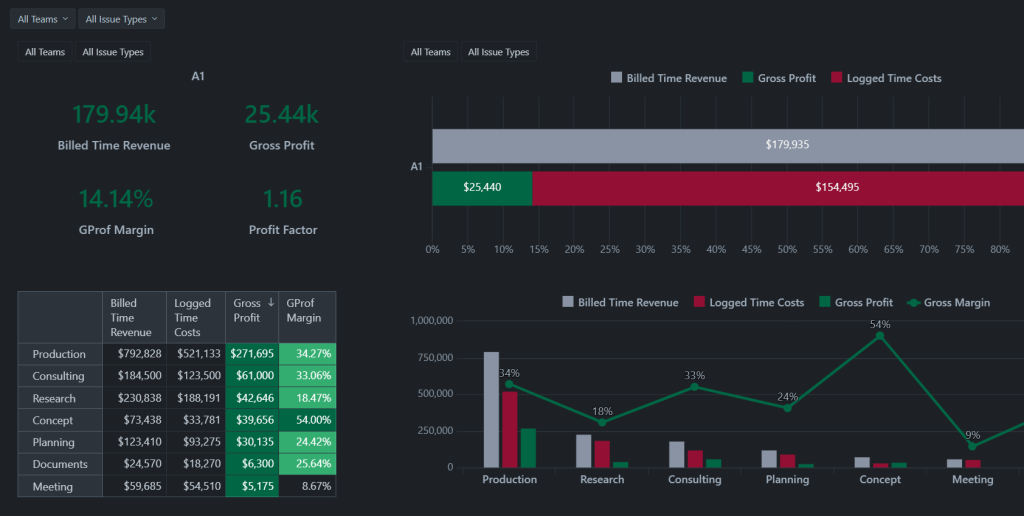
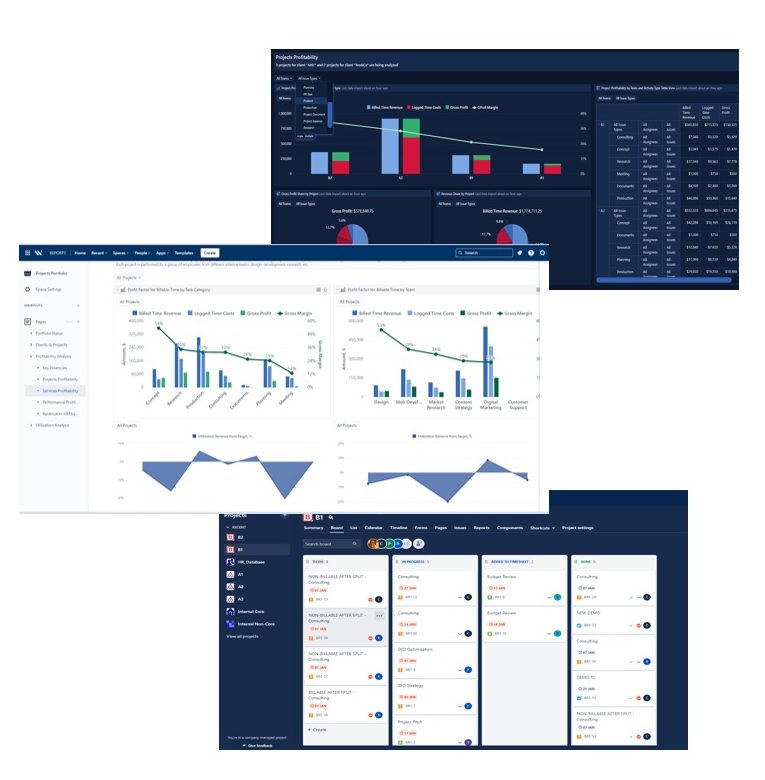
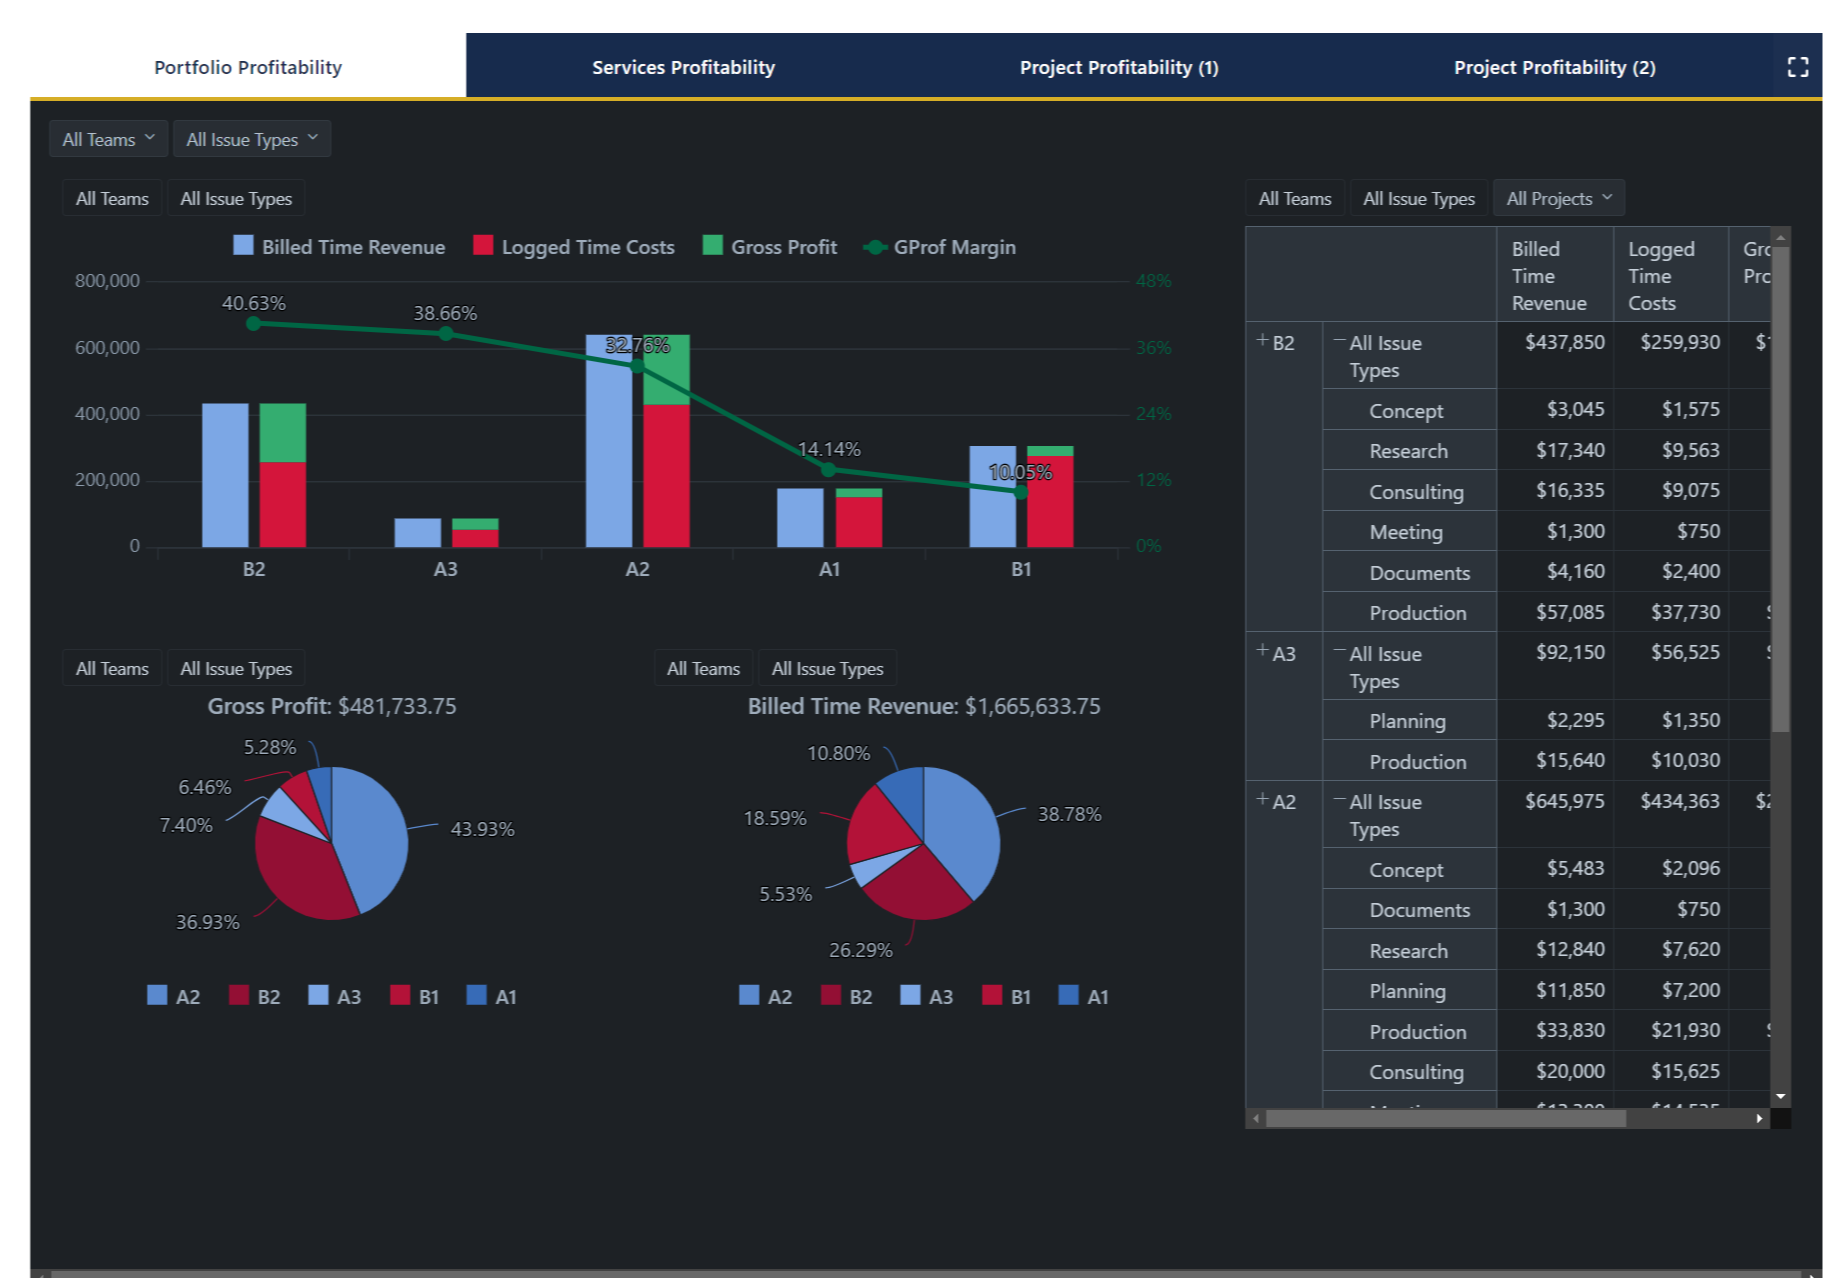
Financial Report Template
Monitor cost, margins, utilization, and profitability with Financial Report Template...
Read More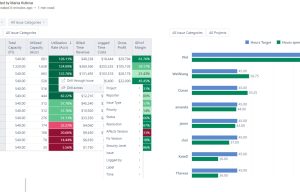
Human Capital Report Template with Jira and EazyBI
Track skills, performance, utilization, learning, and workforce health with the...
Read More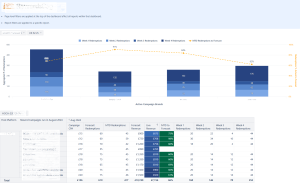
Data Analytics and Business Intelligence Services
Consulting Services Data Analytics and Business Intelligence Services Data analytics...
Read More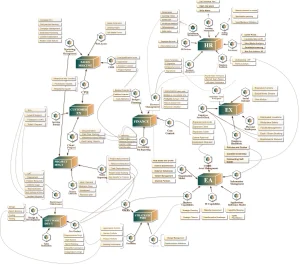
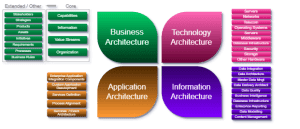
ERP Architecture Development Services
Consulting Services ERP Architecture Development Services We design a clear...
Read More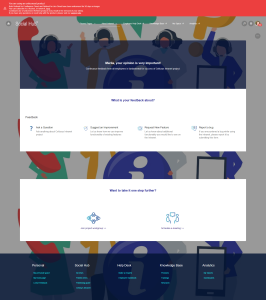
Atlassian Change Management Consulting Service
Consulting Services Atlassian Change Management Consulting Service An Atlassian change...
Read More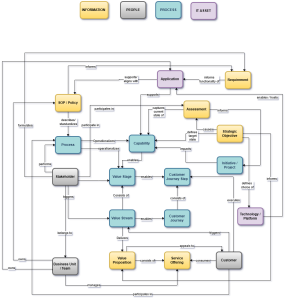
Strategic Portfolio and Program Management Consulting
Consulting Services in progress We design a clear target architecture...
Read More
Standard Operating Procedure (SOP) Development Services
Consulting Services SOP Development Services Standard Operating Procedures integrated into...
Read More